The Ginny Valentine Badge of Courage Awards

I had the honour to attend this week  the Ginny Valenine Badge of Courage awards organised by Fiona Blades and John Griffiths on behalf of the Research Liberation Front  http://researchliberationfront.com/ginny-valentine.html and I wanted to pay tribute to the organisers and to all the winners. What a wonderful moving event this was and long may it live in the future.

Very rarely in a job like market research can I say that I have been emotionally moved by something or really felt such a strong sense of pride as I did at this award ceremony which celebrated some of the less prominent hero's of market research.  It is an award ceremony set up specifically to celebrate those people in market research who had the courage to stick their necks out and do something different, to go against the flow and who battled on through adversity to reach their goals.

The highlights for me were:

Simon Lidington who nominated his own daughter Rosie, for the efforts she put into established the Big Sofa research company. For 4 years she took a sofa around the shopping centres of the country to conduct face to face interviews with the public before pulling in there first major pieces of business.  http://www.thebigsofa.com/about_businessbenefits.html

Betty Adamou's nomination from Ray Poyner for having the courage to put her money where her mouth was and set up her own research gaming company.http://www.researchthroughgaming.com/

And Alison White who was actually brave enough to nominate herself. She explained the battle she had to set up here own field research company, her first attempt was stolen off her, the second her offices were burnt down twice.  http://facefactsresearch.com/ 

But the most astonishing tale of all though was told by Finn Raben who on behalf of ESOMAR nominated an Afghan company ORCA who had 2 researchers shot dead while collecting data.  Which puts all our own battles into perspective.

There were no black ties, 3 course dinners and celebrity presenters at this event, instead home made sandwiches and pay bar but all the better for it. Ginny Valentines son gave a wonderful eulogy to his mother and it was lovely to see him handing out the awards at the end to the winners.


200 question surveys?!!!!

In the presentation I gave yesterday at the MRS conference I mentioned that we had been working on some experimental survey games where we had managed to get people to voluntarily complete a 200 frame survey.

Now firstly, this has been quoted as a 200 "question" survey which I am afraid is a bit of an exaggeration, as a lot of the frames were feedback pages and not questions, it was about 120 questions in total.  I apologise I did not make this clear during my presentation.

I am NOT, may I repeat, NOT espousing or suggesting that anyone does a 200 question survey or indeed a 120 question survey for that matter!!!!!!!

I am slightly concerned about the mixed message this is conveying  and so I thought I should clarify things a little with this blog post about the details of this experiment.

This survey in question was designed purely as an experiment to see how many question respondents were prepared to answer, when instead of doing a survey they were playing a game and getting feedback that was  of some use and interest to them. This was not a traditional survey but a shopping game we had specially designed, that stepped away from the thinking constraints of a typical survey and focusing purely on the game and feedback mechanic.

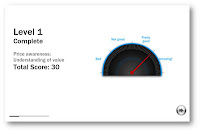
The respondents had to work their way through a series of  "levels" where they were are asked to do things like guess the most and least expensive products, the most and least popular products, the prices of products and try and predict what different celebrities and types of people would buy. See below screen grabs of what the survey looked like.


 They would get points for getting things right and at the end of each level they would find out how well they did and we also revealed to them what this told us about the type of shopper they were.  So for example the respondents found out how price concious they were compared to other people and whether they were a social shopper who buys popular products or a individualist who buys not so popular products.  Each level was voluntary, they were asked if they wanted to proceed to the next level. There were 6 levels in total and 15-20 challenges in each level and we found 94% voluntarily completed all 6 levels spending over 20 minutes on average completing it.   The survey had an enjoyment score of 9.0 out of 10. The highest audience evaluation score we have ever achieved for a survey.

We often say that surveys should not being longer than 20 minutes. That is because most if not all surveys are not entertaining enough to persuade  us to want do them for any longer. Most surveys fail to cross the entertainment divide.  20 minutes is in effect a tolerance limit for expecting anyone to do anything they find boring.  But if you start to look at a survey through the lens of being a piece of entertainment or a game then yes it does open up possibilities for surveys that are genuinely entertaining to be longer than 20 minutes.  After all we happily will watch a film for a couple of hours, read a book all day on holiday play Angry Birds in any spare waking moment we get with our mobile phone.   But the aim of this research was not to path the way for, or encourage the industry to start churning out ever longer dull surveys!


7 factors, No sorry, 78 factors influencing the authenticity of responses

7 factors, No sorry, 78 factors influencing the authenticity of responses


Note:  Having written my post outlining the 7 factors influencing the honestly of responses, Edward Appleton rather politely pointed out that I may well have missed one or two issues! Directing me to this great list of cognitive biases listed on Wikepedia:  http://en.wikipedia.org/wiki/List_of_cognitive_biases

Enjoy reading though them. I think  Confirmation, Congurence, Hindsight Hyperbolic discounting biases are ones I need to watch out for.  I wonder if I should offer a prize to anyone who can come up with any more.

  • Ambiguity effect – the tendency to avoid options for which missing information makes the probability seem "unknown."[6]
  • Anchoring – the tendency to rely too heavily, or "anchor," on a past reference or on one trait or piece of information when making decisions (also called "insufficient adjustment").
  • Attentional Bias – the tendency of emotionally dominant stimuli in one's environment to preferentially draw and hold attention and to neglect relevant data when making judgments of a correlation or association.
  • Availability heuristic – estimating what is more likely by what is more available in memory, which is biased toward vivid, unusual, or emotionally charged examples.
  • Availability cascade – a self-reinforcing process in which a collective belief gains more and more plausibility through its increasing repetition in public discourse (or "repeat something long enough and it will become true").
  • Backfire effect – when people react to disconfirming evidence by strengthening their beliefs[7]
  • Bandwagon effect – the tendency to do (or believe) things because many other people do (or believe) the same. Related to groupthink and herd behavior.
  • Base rate neglect or Base rate fallacy – the tendency to base judgments on specifics, ignoring general statistical information.[8]
  • Belief bias – an effect where someone's evaluation of the logical strength of an argument is biased by the believability of the conclusion.[9]
  • Bias blind spot – the tendency to see oneself as less biased than other people, or to be able to identify more cognitive biases in others than in oneself.[10]
  • Choice-supportive bias – the tendency to remember one's choices as better than they actually were.[11]
  • Clustering illusion – the tendency to under-expect runs, streaks or clusters in small samples of random data
  • Confirmation bias – the tendency to search for or interpret information in a way that confirms one's preconceptions.[12]
  • Congruence bias – the tendency to test hypotheses exclusively through direct testing, in contrast to tests of possible alternative hypotheses.
  • Conjunction fallacy – the tendency to assume that specific conditions are more probable than general ones.[13]
  • Conservatism or Regressive Bias – tendency to underestimate high values and high likelihoods/probabilities/frequencies and overestimate low ones. Based on the observed evidence, estimates are not extreme enough[14][15][5]
  • Contrast effect – the enhancement or diminishing of a weight or other measurement when compared with a recently observed contrasting object.[16]
  • Denomination effect – the tendency to spend more money when it is denominated in small amounts (e.g. coins) rather than large amounts (e.g. bills).[17]
  • Distinction bias – the tendency to view two options as more dissimilar when evaluating them simultaneously than when evaluating them separately.[18]
  • Empathy gap – the tendency to underestimate the influence or strength of feelings, in either oneself or others.
  • Endowment effect – the fact that people often demand much more to give up an object than they would be willing to pay to acquire it.[19]
  • Essentialism - categorizing people and things according to their essential nature, in spite of variations.[20]
  • Exaggerated expectation – based on the estimates, real-world evidence turns out to be less extreme than our expectations (conditionally inverse of the conservatism bias).[21][5]
  • Experimenter's or Expectation bias – the tendency for experimenters to believe, certify, and publish data that agree with their expectations for the outcome of an experiment, and to disbelieve, discard, or downgrade the corresponding weightings for data that appear to conflict with those expectations.[22]
  • Focusing effect – the tendency to place too much importance on one aspect of an event; causes error in accurately predicting the utility of a future outcome.[23]
  • Forward Bias – the tendency to create models based on past data which are validated only against that past data.[citation needed]
  • Framing effect – drawing different conclusions from the same information, depending on how that information is presented.
  • Frequency illusion – the illusion in which a word, a name or other thing that has recently come to one's attention suddenly appears "everywhere" with improbable frequency (see also recency illusion). Sometimes called "The Baader-Meinhof phenomenon".
  • Gambler's fallacy – the tendency to think that future probabilities are altered by past events, when in reality they are unchanged. Results from an erroneous conceptualization of the Law of large numbers. For example, "I've flipped heads with this coin five times consecutively, so the chance of tails coming out on the sixth flip is much greater than heads."
  • Hard-easy effect – Based on a specific level of task difficulty, the confidence in judgments is too conservative and not extreme enough[24][25][26][5]
  • Hindsight bias – sometimes called the "I-knew-it-all-along" effect, the tendency to see past events as being predictable[27] at the time those events happened.(sometimes phrased as "Hindsight is 20/20")
  • Hostile media effect – the tendency to see a media report as being biased due to one's own strong partisan views.
  • Hyperbolic discounting – the tendency for people to have a stronger preference for more immediate payoffs relative to later payoffs, where the tendency increases the closer to the present both payoffs are.[28]
  • Illusion of control – the tendency to overestimate one's degree of influence over other external events.[29]
  • Illusion of validity - when consistent but predictively weak data leads to confident predictions
  • Illusory correlation – inaccurately perceiving a relationship between two unrelated events.[30][31]
  • Impact bias – the tendency to overestimate the length or the intensity of the impact of future feeling states.[32]
  • Information bias – the tendency to seek information even when it cannot affect action.[33]
  • Insensitivity to sample size - the tendency to under-expect variation in small samples
  • Irrational escalation – the phenomenon where people justify increased investment in a decision, based on the cumulative prior investment, despite new evidence suggesting that the decision was probably wrong.
  • Just-world hypothesis – the tendency for people to want to believe that the world is fundamentally just, causing them to rationalize an otherwise inexplicable injustice as deserved by the victim(s).
  • Knowledge bias – the tendency of people to choose the option they know best rather than the best option.[citation needed]
  • Loss aversion – "the disutility of giving up an object is greater than the utility associated with acquiring it".[34] (see also Sunk cost effects and endowment effect).
  • Mere exposure effect – the tendency to express undue liking for things merely because of familiarity with them.[35]
  • Money illusion – the tendency to concentrate on the nominal (face value) of money rather than its value in terms of purchasing power.[36]
  • Moral credential effect – the tendency of a track record of non-prejudice to increase subsequent prejudice.
  • Negativity bias – the tendency to pay more attention and give more weight to negative than positive experiences or other kinds of information.
  • Neglect of probability – the tendency to completely disregard probability when making a decision under uncertainty.[37]
  • Normalcy bias – the refusal to plan for, or react to, a disaster which has never happened before.
  • Observer-expectancy effect – when a researcher expects a given result and therefore unconsciously manipulates an experiment or misinterprets data in order to find it (see also subject-expectancy effect).
  • Omission bias – the tendency to judge harmful actions as worse, or less moral, than equally harmful omissions (inactions).[38]
  • Optimism bias – the tendency to be over-optimistic, overestimating favorable and pleasing outcomes (see also wishful thinkingvalence effectpositive outcome bias).[39][40]
  • Ostrich effect – ignoring an obvious (negative) situation.
  • Outcome bias – the tendency to judge a decision by its eventual outcome instead of based on the quality of the decision at the time it was made.
  • Overconfidence effect – excessive confidence in one's own answers to questions. For example, for certain types of questions, answers that people rate as "99% certain" turn out to be wrong 40% of the time.[41][42][43][5]
  • Pareidolia – a vague and random stimulus (often an image or sound) is perceived as significant, e.g., seeing images of animals or faces in clouds, the man in the moon, and hearing hidden messages on records played in reverse.
  • Pessimism bias – the tendency for some people, especially those suffering from depression, to overestimate the likelihood of negative things happening to them.
  • Planning fallacy – the tendency to underestimate task-completion times.[32]
  • Post-purchase rationalization – the tendency to persuade oneself through rational argument that a purchase was a good value.
  • Pro-innovation bias – the tendency to reflect a personal bias towards an invention/innovation, while often failing to identify limitations and weaknesses or address the possibility of failure.
  • Pseudocertainty effect – the tendency to make risk-averse choices if the expected outcome is positive, but make risk-seeking choices to avoid negative outcomes.[44]
  • Reactance – the urge to do the opposite of what someone wants you to do out of a need to resist a perceived attempt to constrain your freedom of choice.
  • Recency bias – a cognitive bias that results from disproportionate salience of recent stimuli or observations – the tendency to weigh recent events more than earlier events (see also peak-end rule).
  • Recency illusion – the illusion that a phenomenon, typically a word or language usage, that one has just begun to notice is a recent innovation (see also frequency illusion).
  • Regressive Bayesian likelihood – estimates of conditional probabilities are conservative and not extreme enough[45][46][5]
  • Restraint bias – the tendency to overestimate one's ability to show restraint in the face of temptation.
  • Selective perception – the tendency for expectations to affect perception.
  • Semmelweis reflex – the tendency to reject new evidence that contradicts a paradigm.[47]
  • Social comparison bias – the tendency, when making hiring decisions, to favour potential candidates who don't compete with one's own particular strengths.[48]
  • Status quo bias – the tendency to like things to stay relatively the same (see also loss aversion, endowment effect, and system justification).[49][50]
  • Stereotyping – expecting a member of a group to have certain characteristics without having actual information about that individual.
  • Subadditivity effect – the tendency to estimate that the likelihood of an event is less than the sum of its (more than two) mutually exclusive components.[51]
  • Subjective validation – perception that something is true if a subject's belief demands it to be true. Also assigns perceived connections between coincidences.
  • Unit bias – the tendency to want to finish a given unit of a task or an item. Strong effects on the consumption of food in particular.[52]
  • Well travelled road effect – underestimation of the duration taken to traverse oft-traveled routes and over-estimate the duration taken to traverse less familiar routes.
  • Zero-risk bias – preference for reducing a small risk to zero over a greater reduction in a larger risk.


Evolution of Advertising v Survey design


Designing surveys is without doubt a creative process similar in many ways to other creative commercial art forms like advertising and presentation design.  I feel there is something we can learn from looking at the evolution of these other sister creative processes...


The evolution of advertising

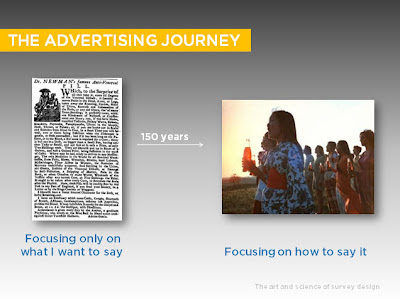
Once upon a time advertising look like this...


But unfortunately not many people were reading them.  So they began to evolve.  They first of all started to realise the value of adding images...
And slowly over the course of 100 years or so they learnt the art of creative communication...
Minimalising the use of text and focusing on branding and selling messages and visuals grabbed peoples attention and re-enforced the message. 
Leading eventually to the evolution of the advertising agency...
Companies realise realising that they did not quite have the skills to do this job themselves, they passed it on to people who specialised in it.

And who today would deny the importance of creativity in advertising design.


Over a period of 200 years advertising moved from focusing only on what people wanted to say to focusing on how to say it.

Presentation design

A similar journey has been made in the development of presentation design.  Once upon a time presentations looked like this, text heavy and dominated by bullet points


They then tried rather unsuccessfully to liven them up with clipart and whacky transition effects..


And by throwing everything they could think of onto the page to grab your attention....


But slowly they learnt that colour and images should not be used just to decorate per say, but to help communicate ideas more clearly...

Image courtesy of Presentation Zen

And they learnt to cut back on content and use well chosen visuals to help emphasise content and make it more memorable...


And many of us now would probably call in a designer to help us create an important presentations say if we were delivering to 50 people at a conference..


Over the course of 20 years we have moved from focusing only on what we wanted to say to focussing on how to communicate a message.

And so to survey design...

Once upon a time surveys used to look like this..

 And they now tend look like this...

Sorry I am being a bit unfair there as there are people creating surveys that do look better than this, and so this is probably a bit of a cheep trick,  but I hope you get my point that this is still today what the majority of surveys look like.  We have not really got our heads round the survey design process quite yet.  I would say we are still at the 1980's clip art and whacky transitions stage of things. Our idea of making a survey more creative is to add in often a badly designed flash question or slapping a thumbs up icon on the top of a likert scale.  Our only real concession to the consumer in 15 year has been to add a progress bar, but I have seen recently suggestions we should take it off as it is causing drop-out (presumably because they are looking at it and thinking oh dear how much more of this survey have I got to endure!)

There is almost no basic grasp of design aesthetics in most surveys I see, very little effective use of imagery and that is just the start. The problems extend far beyond the visual. Our whole approach to the structure and copy writing of surveys is stuck in the 1950's when face to face interviews were pioneered, with these long verbose questions that nobody want to read and no sense of what it feels like as a respondent to answer a typical survey.


Over the course of the last 15 years we have not really moved very far, we still are focussing solely on what we want to know and give little but scant thought to ways to get respondents to give more effective and thoughtful feedback which is where I think we need to be at.

A question then is why?


Well there are clearly lots of reasons but the one thing in my mind is that we have not officially recognised as an industry survey design as a creative skill and we are not sure who's job it is either. And it is a task that is falling between 2 stalls...


Right now the only time creativity is considered is when the survey has been signed off and passed onto the survey programmer which I my mind is too late.  And just the term survey "programmer"  itself says something, often this is someone in a "downstairs"  department so to speak who you are not really actually expecting any creativity from.  


I feel that creativity needs to be injected right up the line starting at the conception stage and really needs to be focused at the writing stage, how we copy write and conceive questions and structure surveys is so important which is something I will be discussing in a later post.  

My main point though is that we need to recognise the importance of creativity in research design and establish creative service teams in research companies that take charge of injecting more creativity in research design across the board, who have the authority to orchestrate things higher up the line than at the production stage.  Akin to the authority an advertising agency has over the design of advertising.  

Note: This topic and these slides are an extract from a presentation I recently delivered at the WARC 2012 conference on the future of Online research where I was talking about how to inject more creativity in survey design.  The full deck and the full story can accessed from 
www.warc.com/OnlineResearch2012

Follow the discussion of this event from twitter on #nowandnext


Quirks Research Gamification Article


Here for those who have not seen it yet is a link to an article I have written on Research Gamification for Quirk's online Marketing Research magazine.


Kategori

Kategori